IC Markets Home Sign in Web Trader Contact Us
IC Markets Social IC Markets Social

Information Hub for
Serious Traders

  • ABOUT US
  • OPEN LIVE ACCOUNT
  • OPEN DEMO ACCOUNT
  • TRADE NOW
  • VISIT OUR BLOG
IC Markets Social
  • ABOUT US
  • OPEN LIVE ACCOUNT
  • OPEN DEMO ACCOUNT
  • TRADE NOW
  • VISIT OUR BLOG
September 3, 2021North_American_Stocks_ptIC Markets

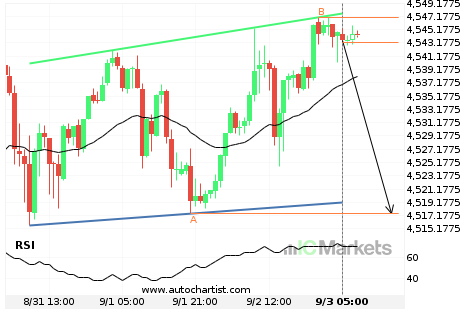
US SPX 500 Index Nível visado: 4517.5000

Canal ascendente identificado em 03-set-2021 05:00 EDT. Este padrão está ainda em processo de formação. Possível previsão de movimento em baixa para o nível de 4517.5000 no próximo 19 horas.

Read more
September 2, 2021North_American_Stocks_ptIC Markets

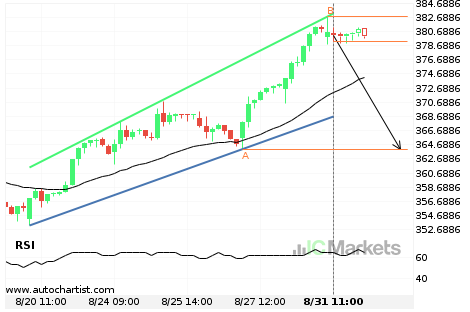
US Tech 100 Index Nível visado: 15679.8000

Cunha ascendente identificado em 02-set-2021 07:00 EDT. Este padrão está ainda em processo de formação. Possível previsão de movimento em alta para o nível de 15679.8000 no próximo 2 dias.

Read more
September 1, 2021North_American_Stocks_ptIC Markets

FACEBOOK Nível visado: 364.0800

Canal ascendente identificado em 31-ago-2021 11:00 EDT. Este padrão está ainda em processo de formação. Possível previsão de movimento em baixa para o nível de 364.0800 no próximo 11 horas.

Read more
August 31, 2021North_American_Stocks_ptIC Markets

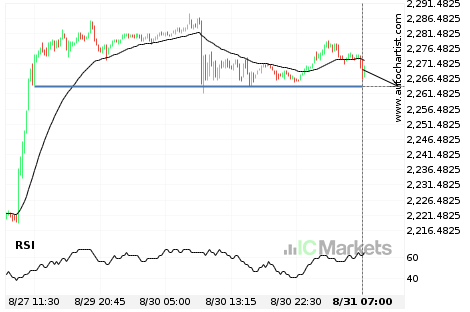
US Small Cap 2000 Index Nível visado: 2263.9700

Aproximando-Apoiar nível de 2263.9700 identificado em 31-ago-2021 07:00 EDT

Read more
August 30, 2021North_American_Stocks_ptIC Markets

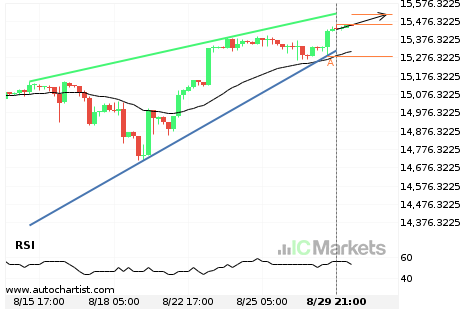
US Tech 100 Index Nível visado: 15387.3000

Cunha ascendente identificado em 29-ago-2021 21:00 EDT. Este padrão está ainda em processo de formação. Possível previsão de movimento em alta para o nível de 15387.3000 no próximo 3 dias.

Read more
August 26, 2021North_American_Stocks_ptIC Markets

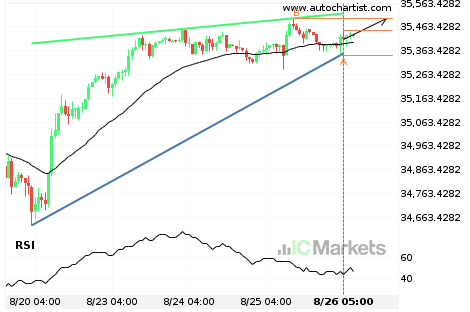
US Wall Street 30 Index Nível visado: 35498.8000

Cunha ascendente identificado em 26-ago-2021 05:00 EDT. Este padrão está ainda em processo de formação. Possível previsão de movimento em alta para o nível de 35498.8000 no próximo dia.

Read more
August 25, 2021North_American_Stocks_ptIC Markets

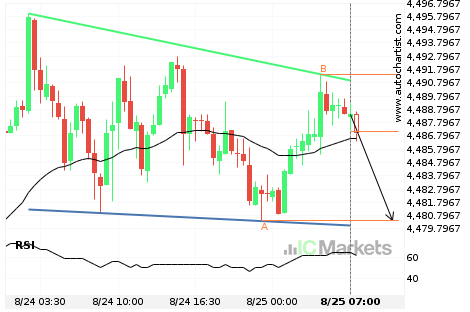
US SPX 500 Index Nível visado: 4480.4000

Triângulo Descendente identificado em 25-ago-2021 07:00 EDT. Este padrão está ainda em processo de formação. Possível previsão de movimento em baixa para o nível de 4480.4000 no próximo 9 horas.

Read more
August 24, 2021North_American_Stocks_ptIC Markets

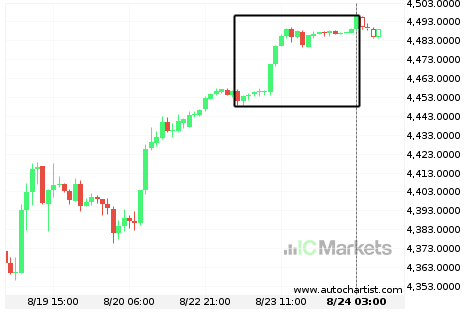
Grande Movimento US SPX 500 Index

US SPX 500 Index experimentou um 1% em alta movimento no(a) último(a) 24 horas.

Read more
August 23, 2021North_American_Stocks_ptIC Markets

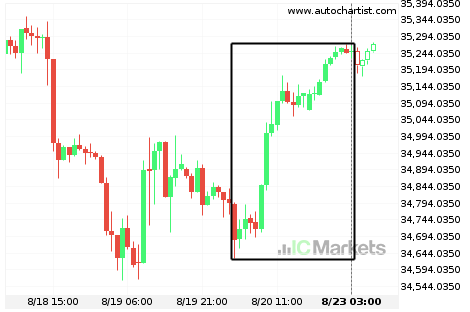
Grande Movimento US Wall Street 30 Index

US Wall Street 30 Index experimentou um 1.63% em alta movimento no(a) último(a) 72 horas.

Read more
August 20, 2021North_American_Stocks_ptIC Markets

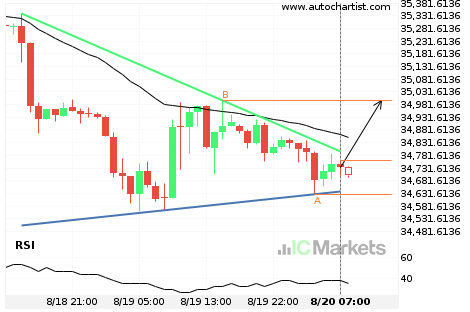
US Wall Street 30 Index Nível visado: 34995.8000

Triângulo identificado em 20-ago-2021 07:00 EDT. Este padrão está ainda em processo de formação. Possível previsão de movimento em alta para o nível de 34995.8000 no próximo 12 horas.

Read more
  • 1
  • 2
  • 3
  • …
  • 73
  • 74
  • 75
  • 76
  • 77
  • 78
  • 79
  • …
  • 87
  • 88
  • 89

Recent Posts

  • Hong Kong 50 Index – รูปแบบกราฟ – สามเหลี่ยมขาขึ้น
  • Hong Kong 50 Index – نموذج الرسم البياني – مثلث صاعد
  • Germany 30 Index – ระดับสำคัญ – แนวรับ
  • Germany 30 Index – المستوى الرئيسي – سند
  • Hong Kong 50 Index – المستوى الرئيسي – مقاومة

Recent Comments

    Translation


     Edit Translation

    Trade with

    a market leader you can rely on

    Open Trading Account Try a Free Demo

    Forex Trading

    • Accounts Overview
    • Open an Account
    • Launch Web Trader

    Trading Specifications

    • Spreads and Commissions
    • Range of Market
    • Trading Hours
    • Funding
    • Withdrawal

    About IC Markets

    • Help Center
    • Why IC Markets
    • Regulation
    • Legal Documents
    • Contact Us


    Forex Trading

    • Accounts Overview
    • Open an Account
    • Launch Web Trader

    Trading Specifications

    • Spreads and Commissions
    • Range of Market
    • Trading Hours
    • Funding
    • Withdrawal

    About IC Markets

    • Chat with a Specialist 24/7
    • Why IC Markets
    • Regulation
    • Legal Documents
    • Contact Us

    Disclaimer: This material is marketing material where all marketing material is published for informational purposes only. This material does not contain and should not be considered as containing - investment advice and recommendations, or suggestions for performing any actions with financial instruments. The built-in widgets belong to their external independent authors, and IC Markets is not responsible for their content and their impact on trade.

    All content rights reserved. Opinions of the authors may not coincide with the opinion of the blog editors. When copying materials from this site or connecting to an RSS feed to republish our articles, a link to IC Markets or attribution in the format ‘IC Markets Blog’ is required. For general questions, please contact the editorial office via the form on the Contact us page.

    Risk Warning: Trading Derivatives carries a high level of risk to your capital and you should only trade with money you can afford to lose. Trading Derivatives may not be suitable for all investors, so please ensure that you fully understand the risks involved and seek independent advice if necessary. A Product Disclosure Statement (PDS) should be considered before entering into a transaction with us.

    The contents of this page are general information only and does not take into account your personal situation, financial objectives or needs. It is up to you to make sure the products that we offer suit your specific needs. You should not trade with us unless you understand the features and risks of the products that we offer. This means that you might need to seek independent advice before you start trading with us.

    © 2022 Raw Trading Ltd | All rights reserved.
    • Sample Page